Big data visualization with 4.4 billion New York taxi rides
New York has published a record of every taxi ride since 2009 and every app ride since 2015. I read all of them, 82 GB of files, to see how the apps replaced the yellow cab, and at the end your browser queries a week of real trips by itself. This post covers how I built it and what the same work can do with a company's own data.
I wanted to build something on a dataset too big to open in a spreadsheet, from a source that publishes everything and does not ration how often you can ask for it. The one I settled on is the New York City Taxi and Limousine Commission’s trip records, which hold one row for every yellow cab ride since 2009 and every ride ordered through an app since 2015, with when and where it started, where it ended, and what it cost. All of it comes to 598 monthly files, about 82 GB, and 4.43 billion rows. Hailed is the page I built from them. It is a scroll story about the apps replacing the yellow cab, every number on it counted from the records, and it ends with a panel where your own browser loads a week of real trips and answers questions about them without a server. It is at hailed.balian.dev, and I am writing it up because the hard parts of this project are the same hard parts a business hits with its own data.
What the trip records show about Uber vs taxi
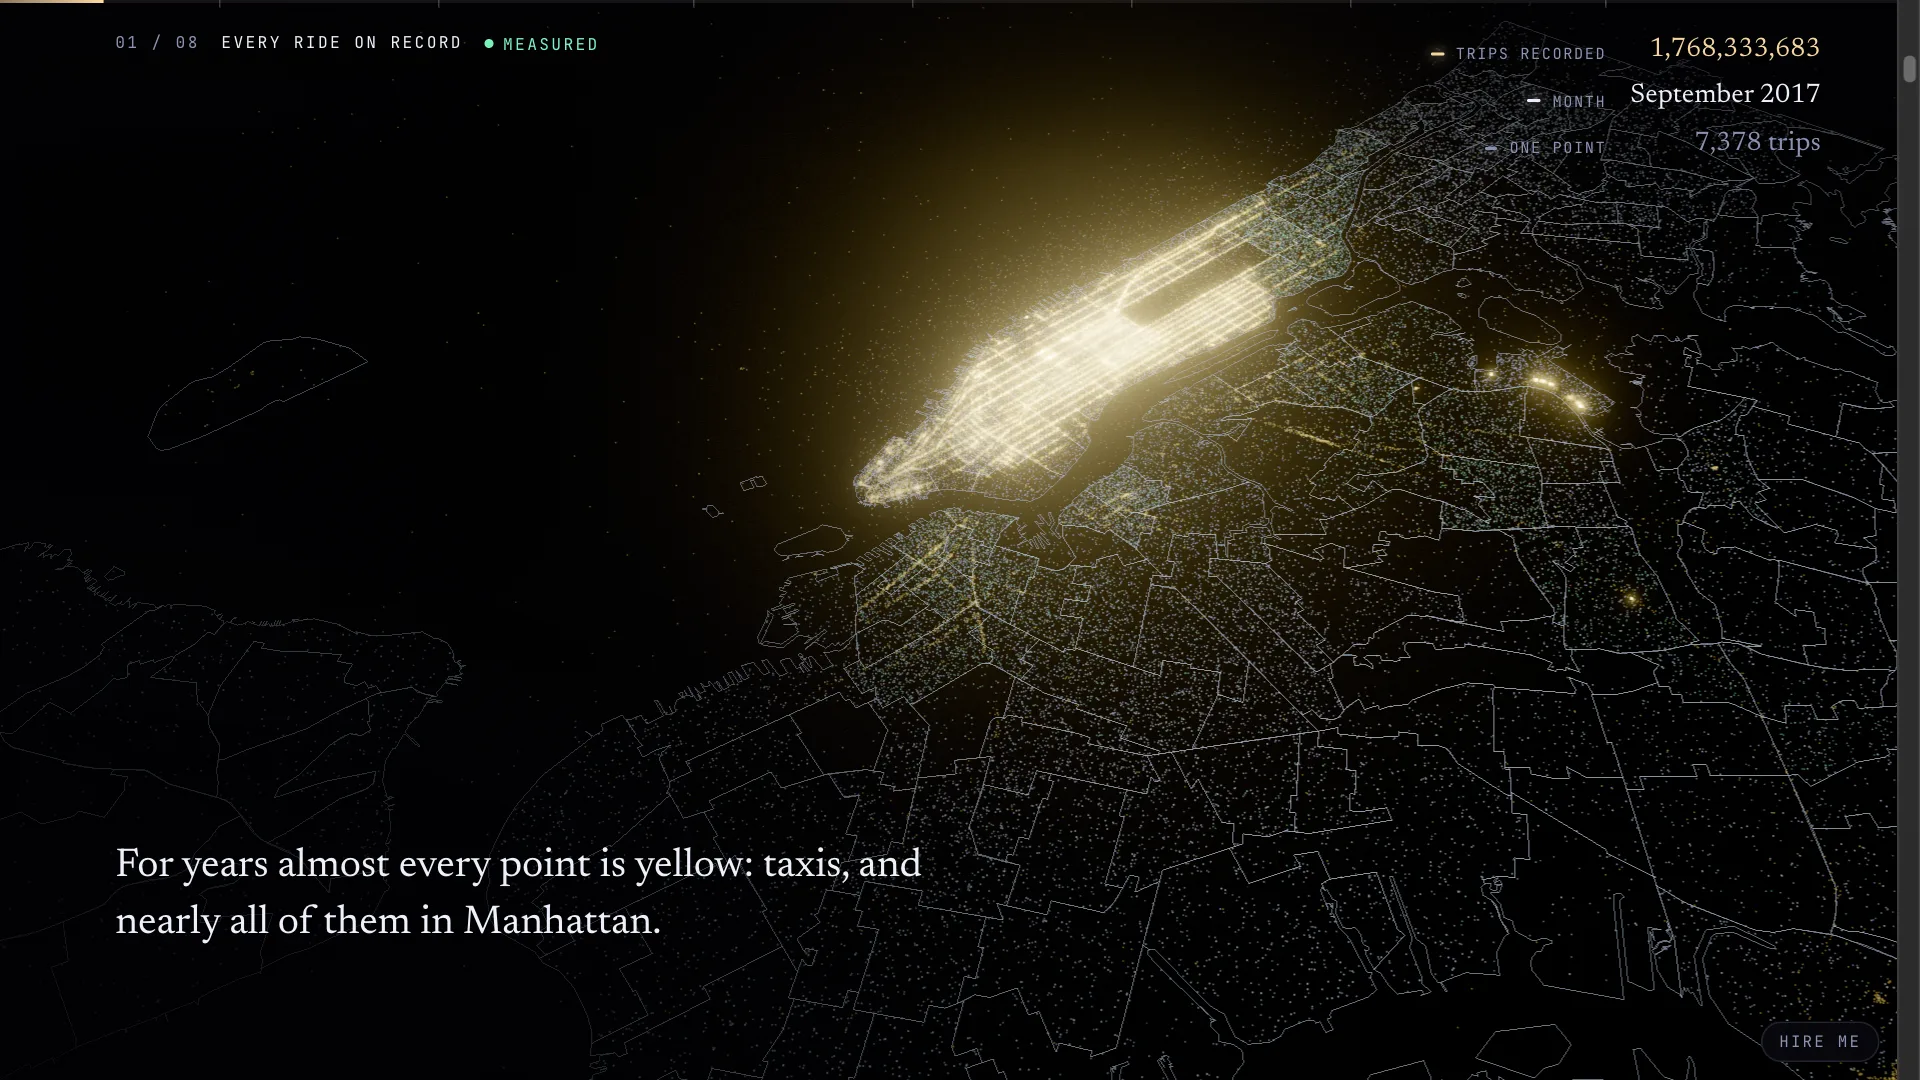
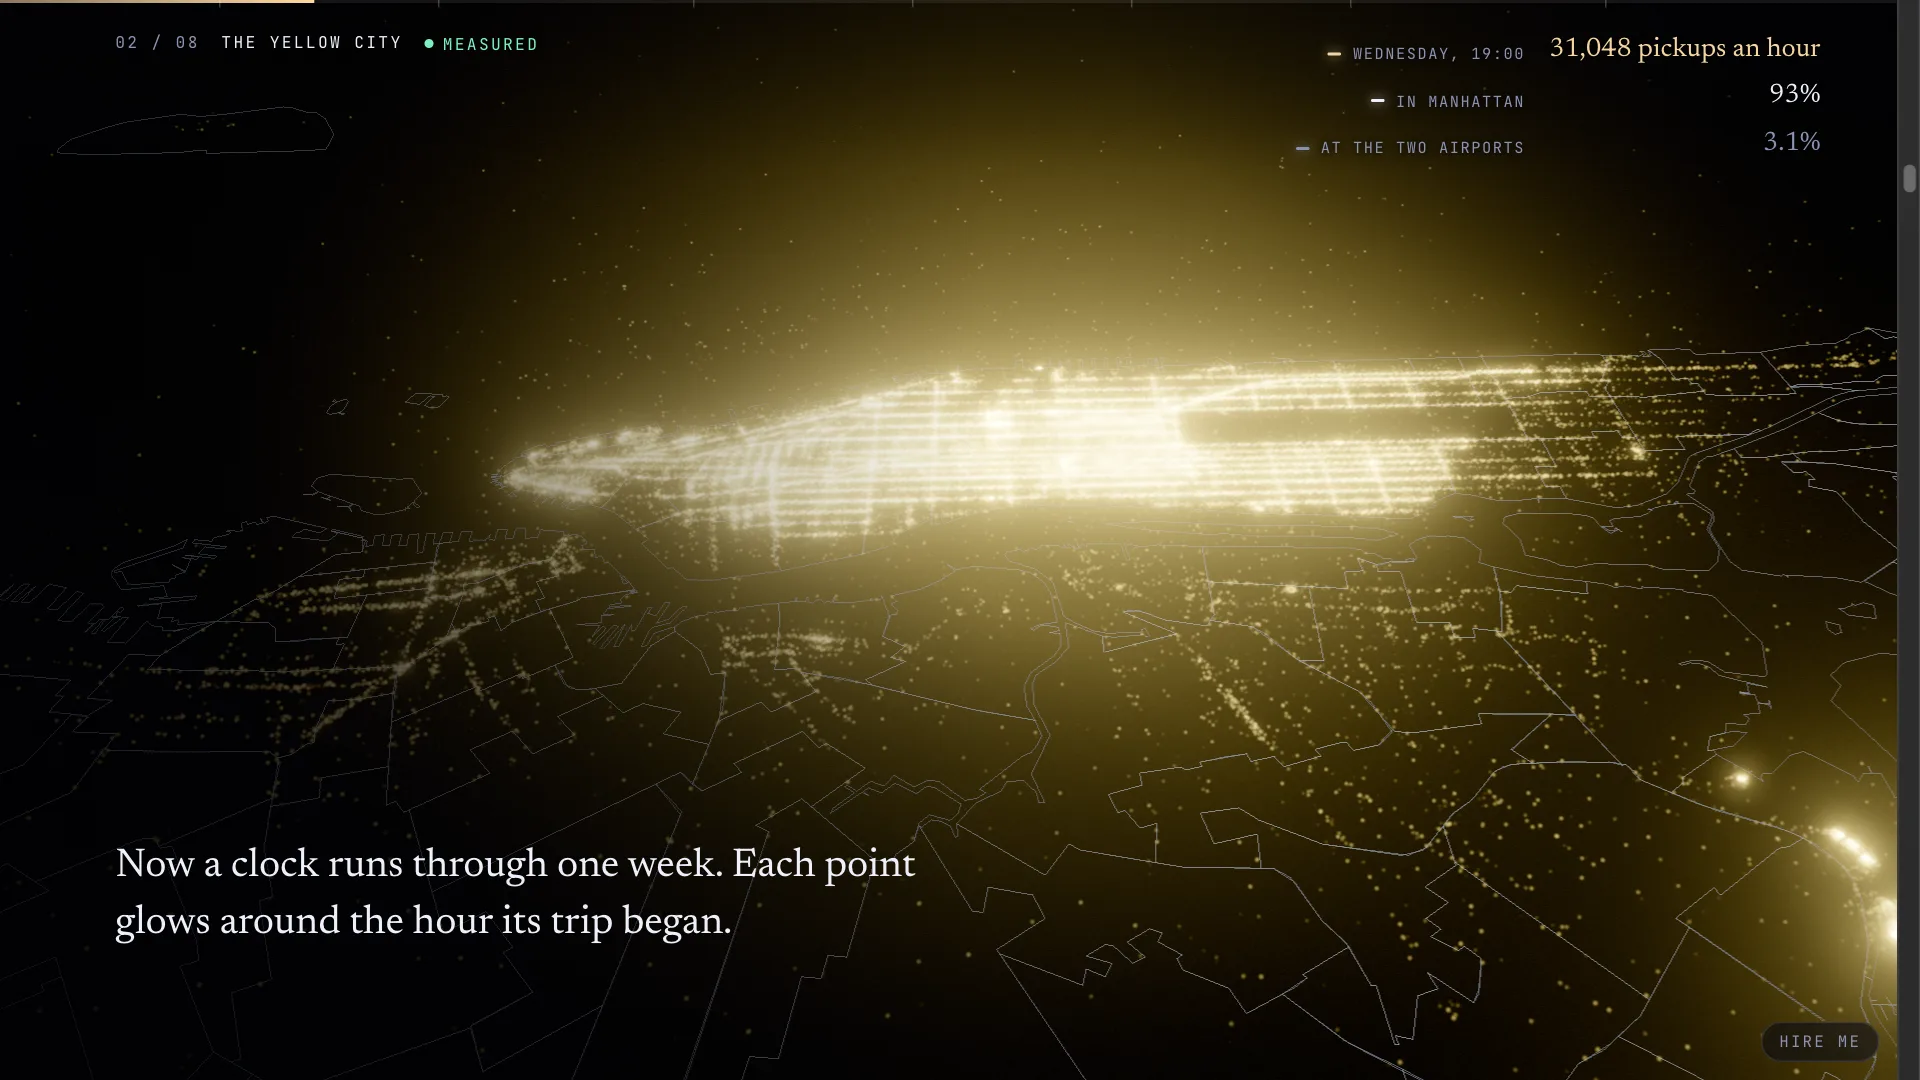
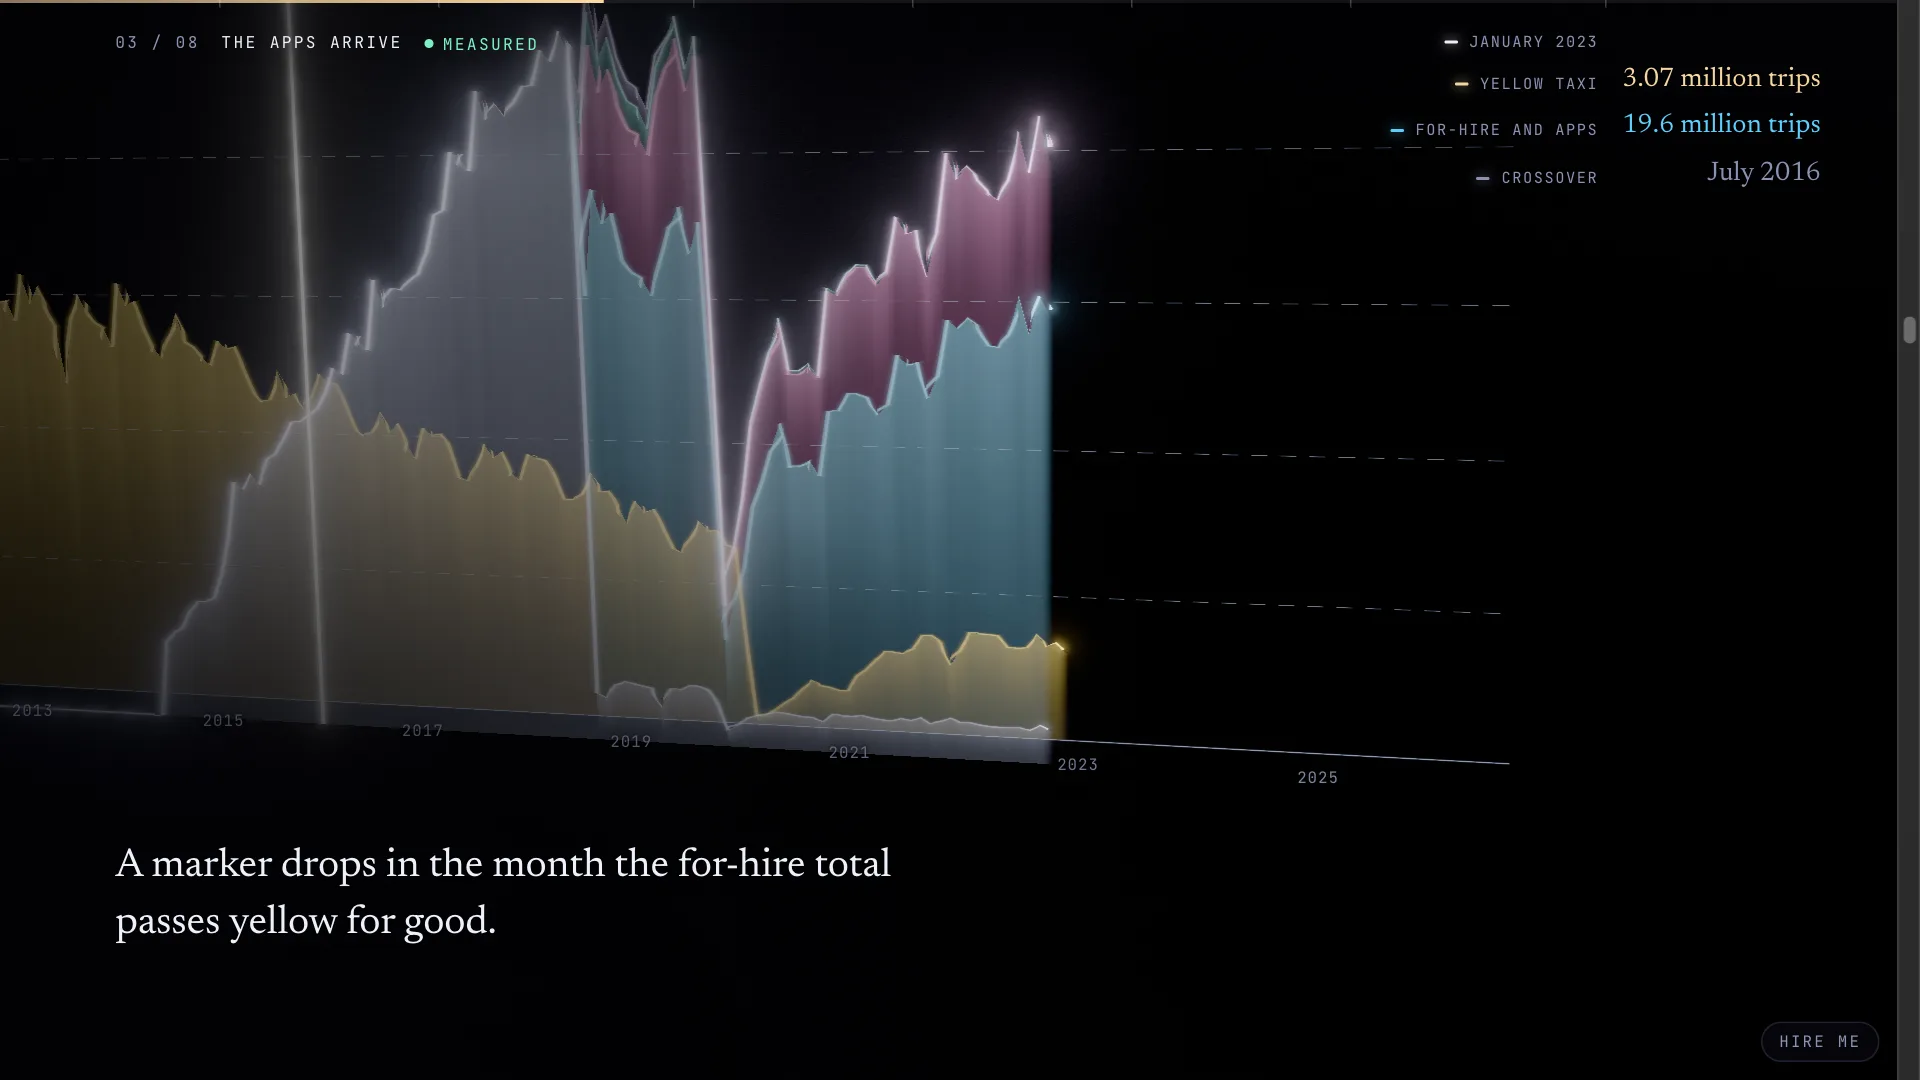
Before the apps the yellow cab was the whole business, and 93 percent of its pickups were in Manhattan. Its busiest month was March 2012, with 16.1 million trips. App rides enter the records in 2015, and in July 2016 the for-hire total passed the yellow cab and never fell back. The records only name the companies from February 2019, so before that the for-hire band mixes the apps with the old car services, and the page says so where it matters. By August 2026 the city logged 3.3 million yellow trips against 22.9 million for-hire trips.
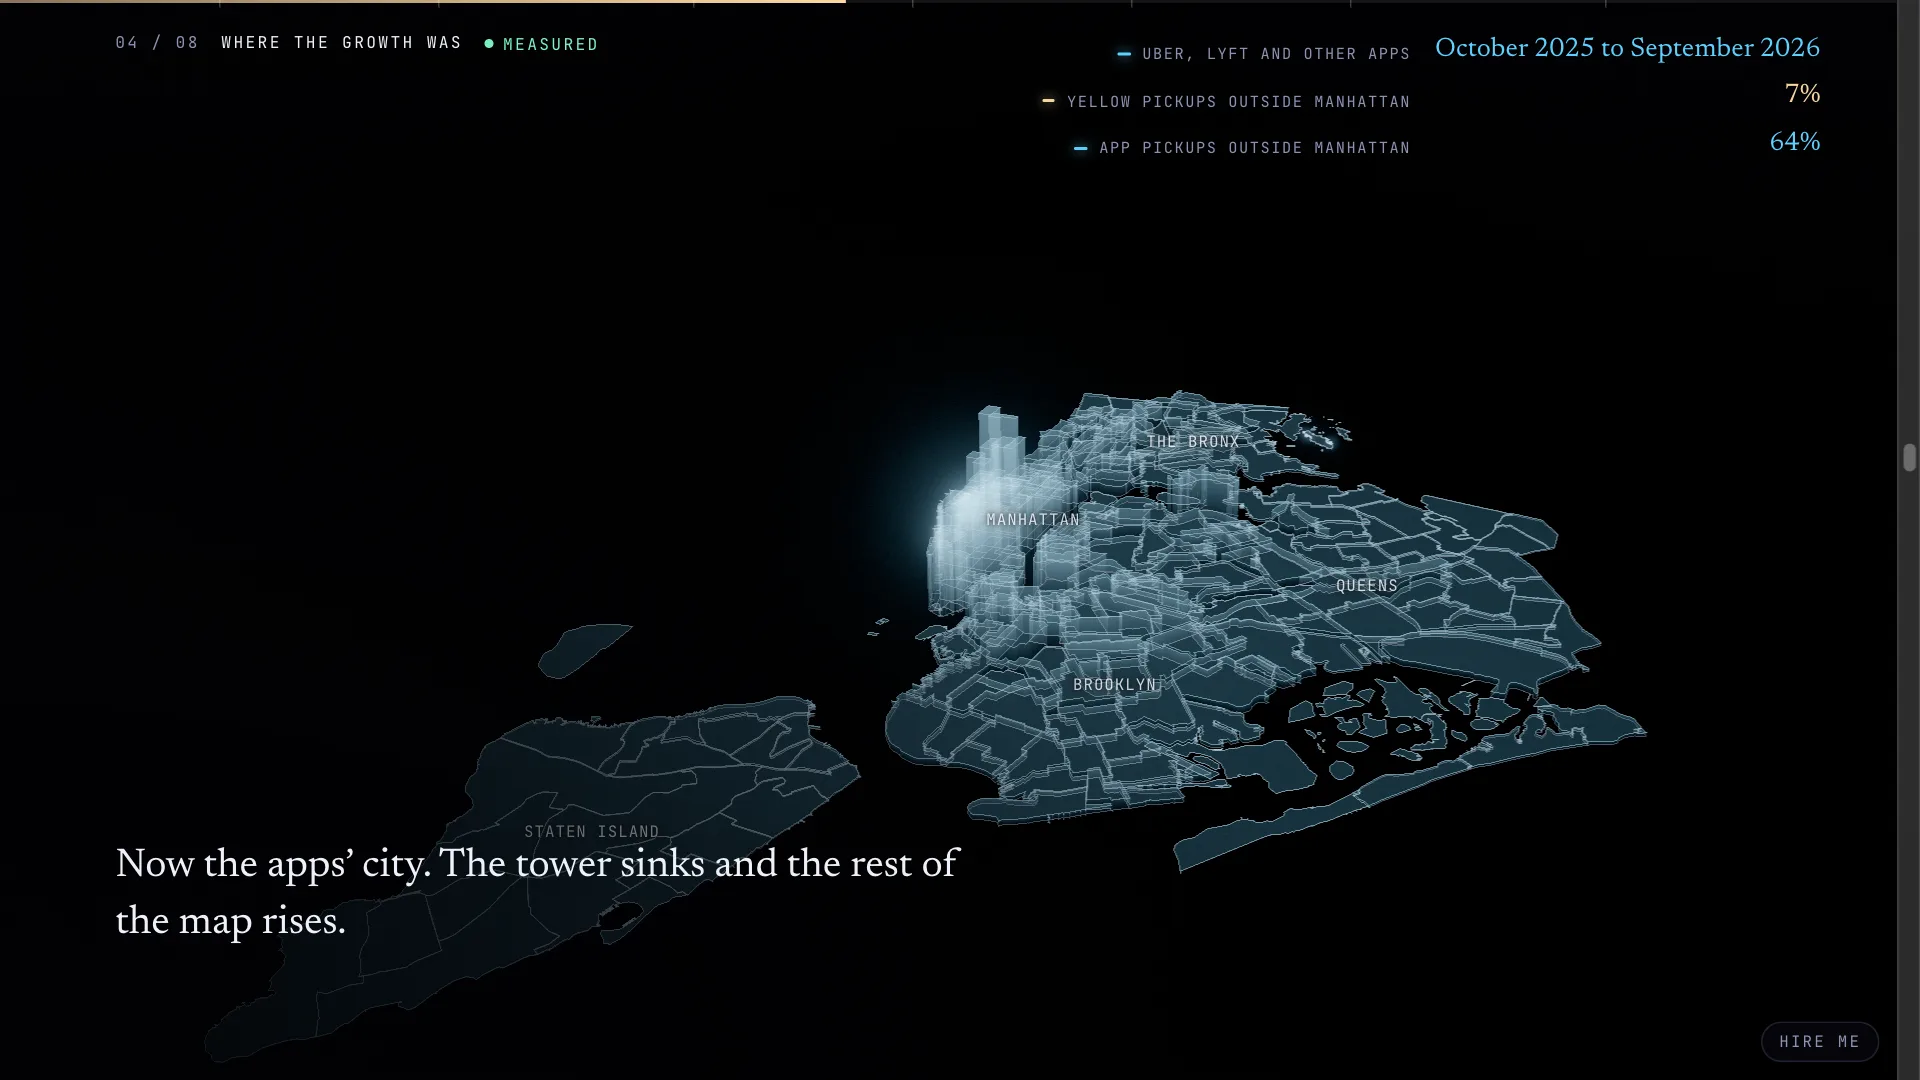
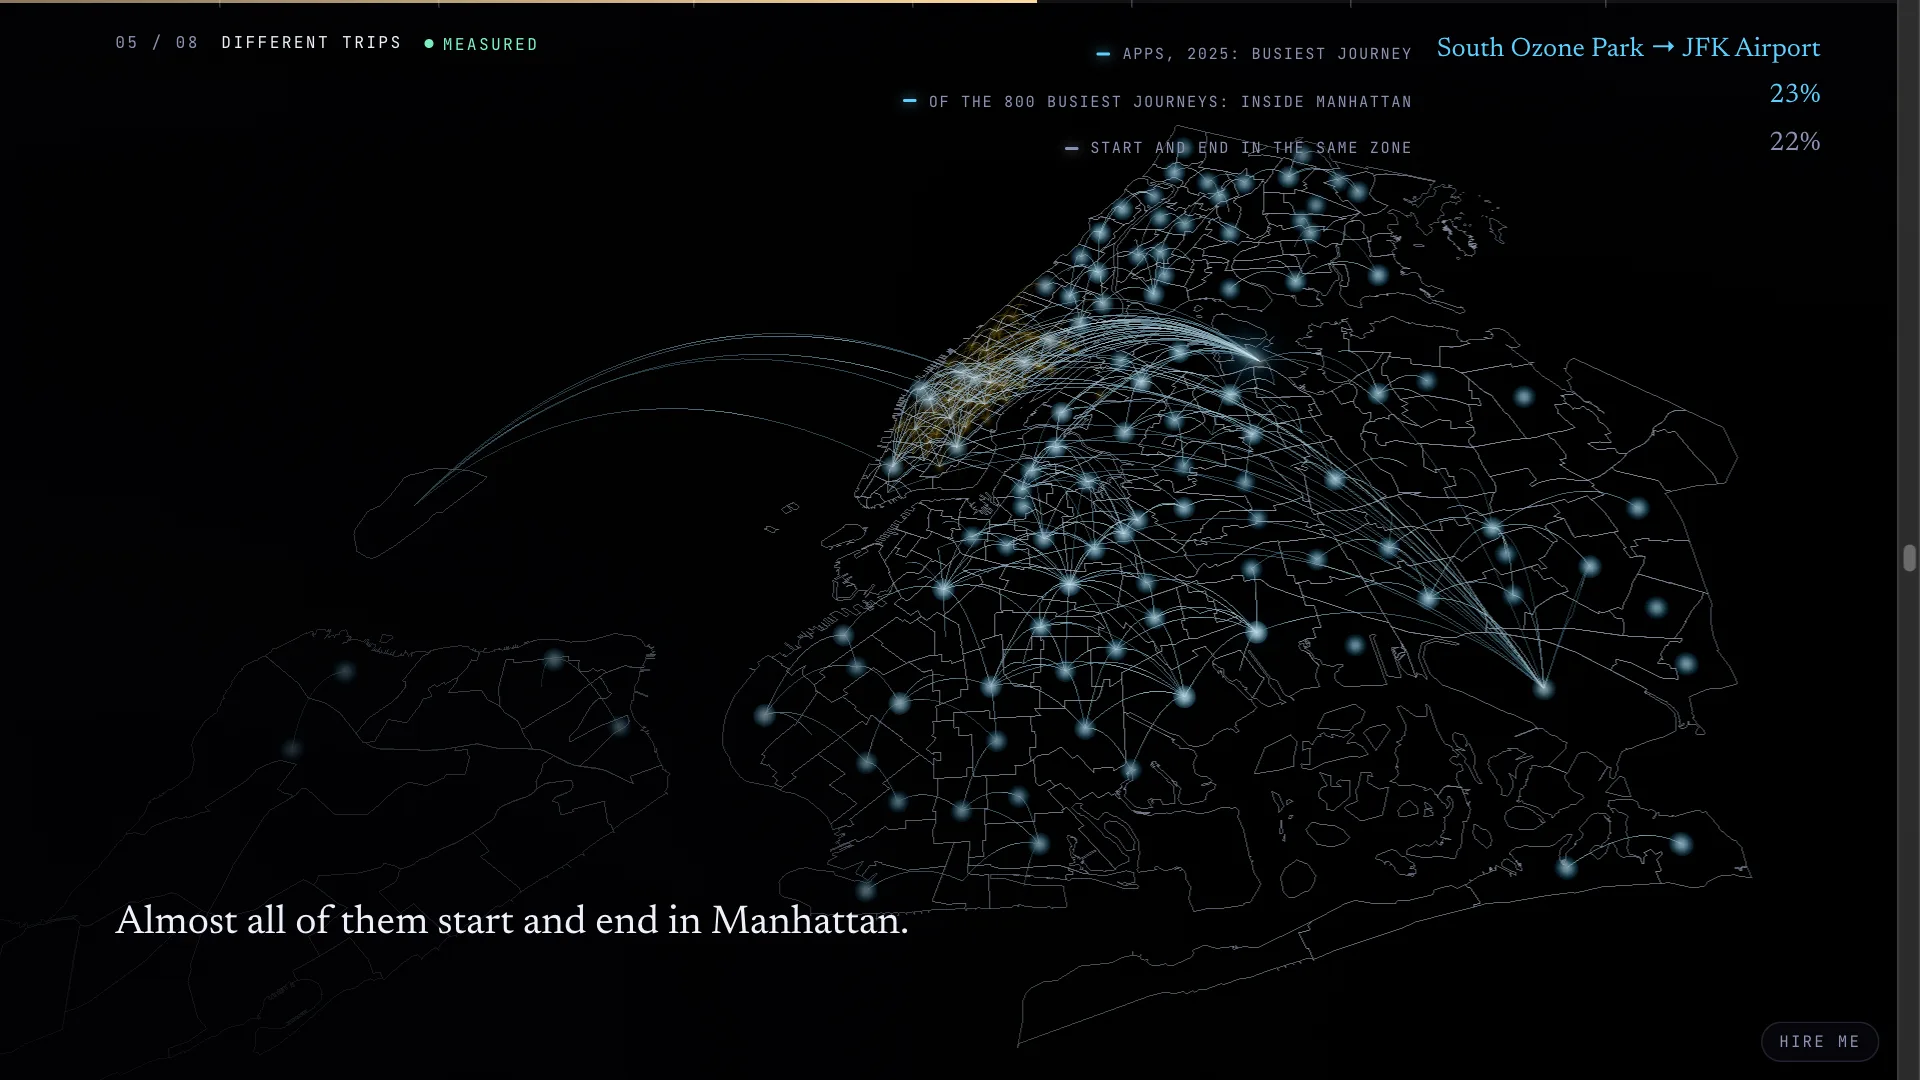
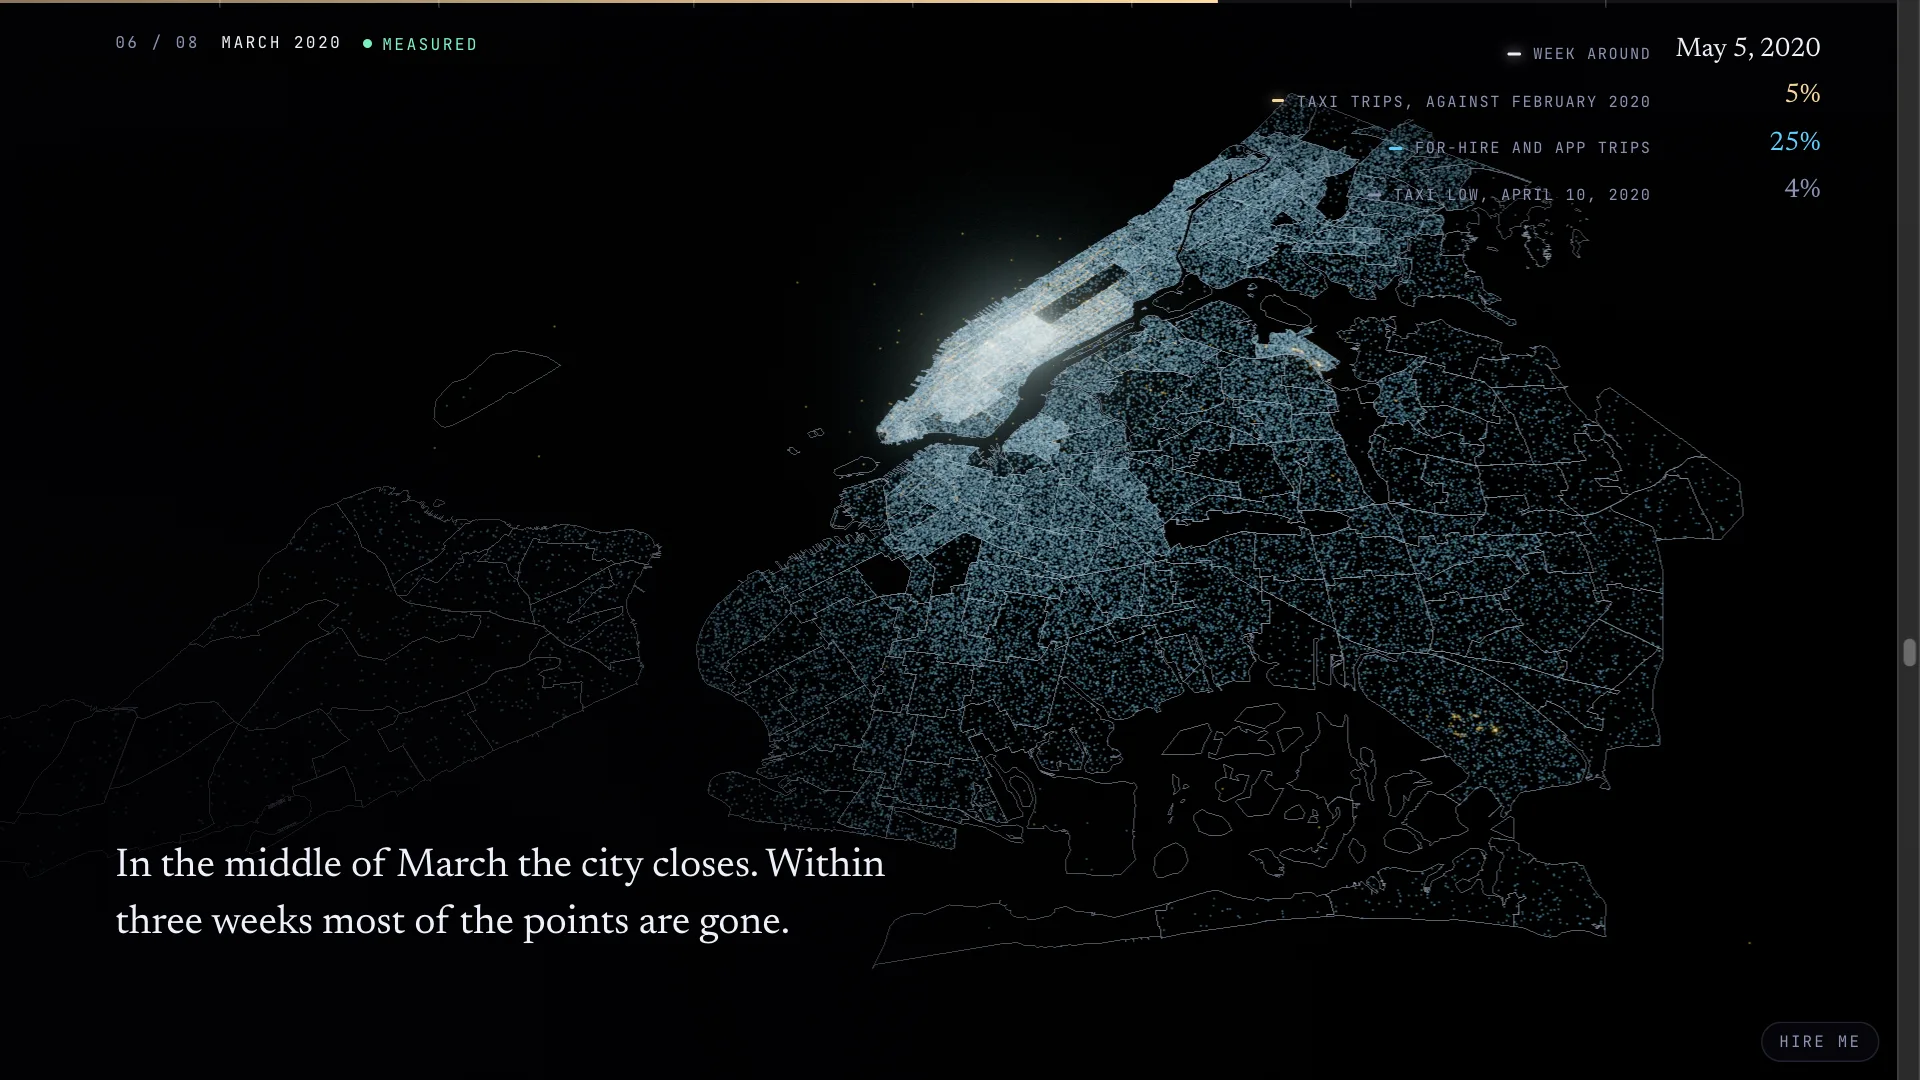
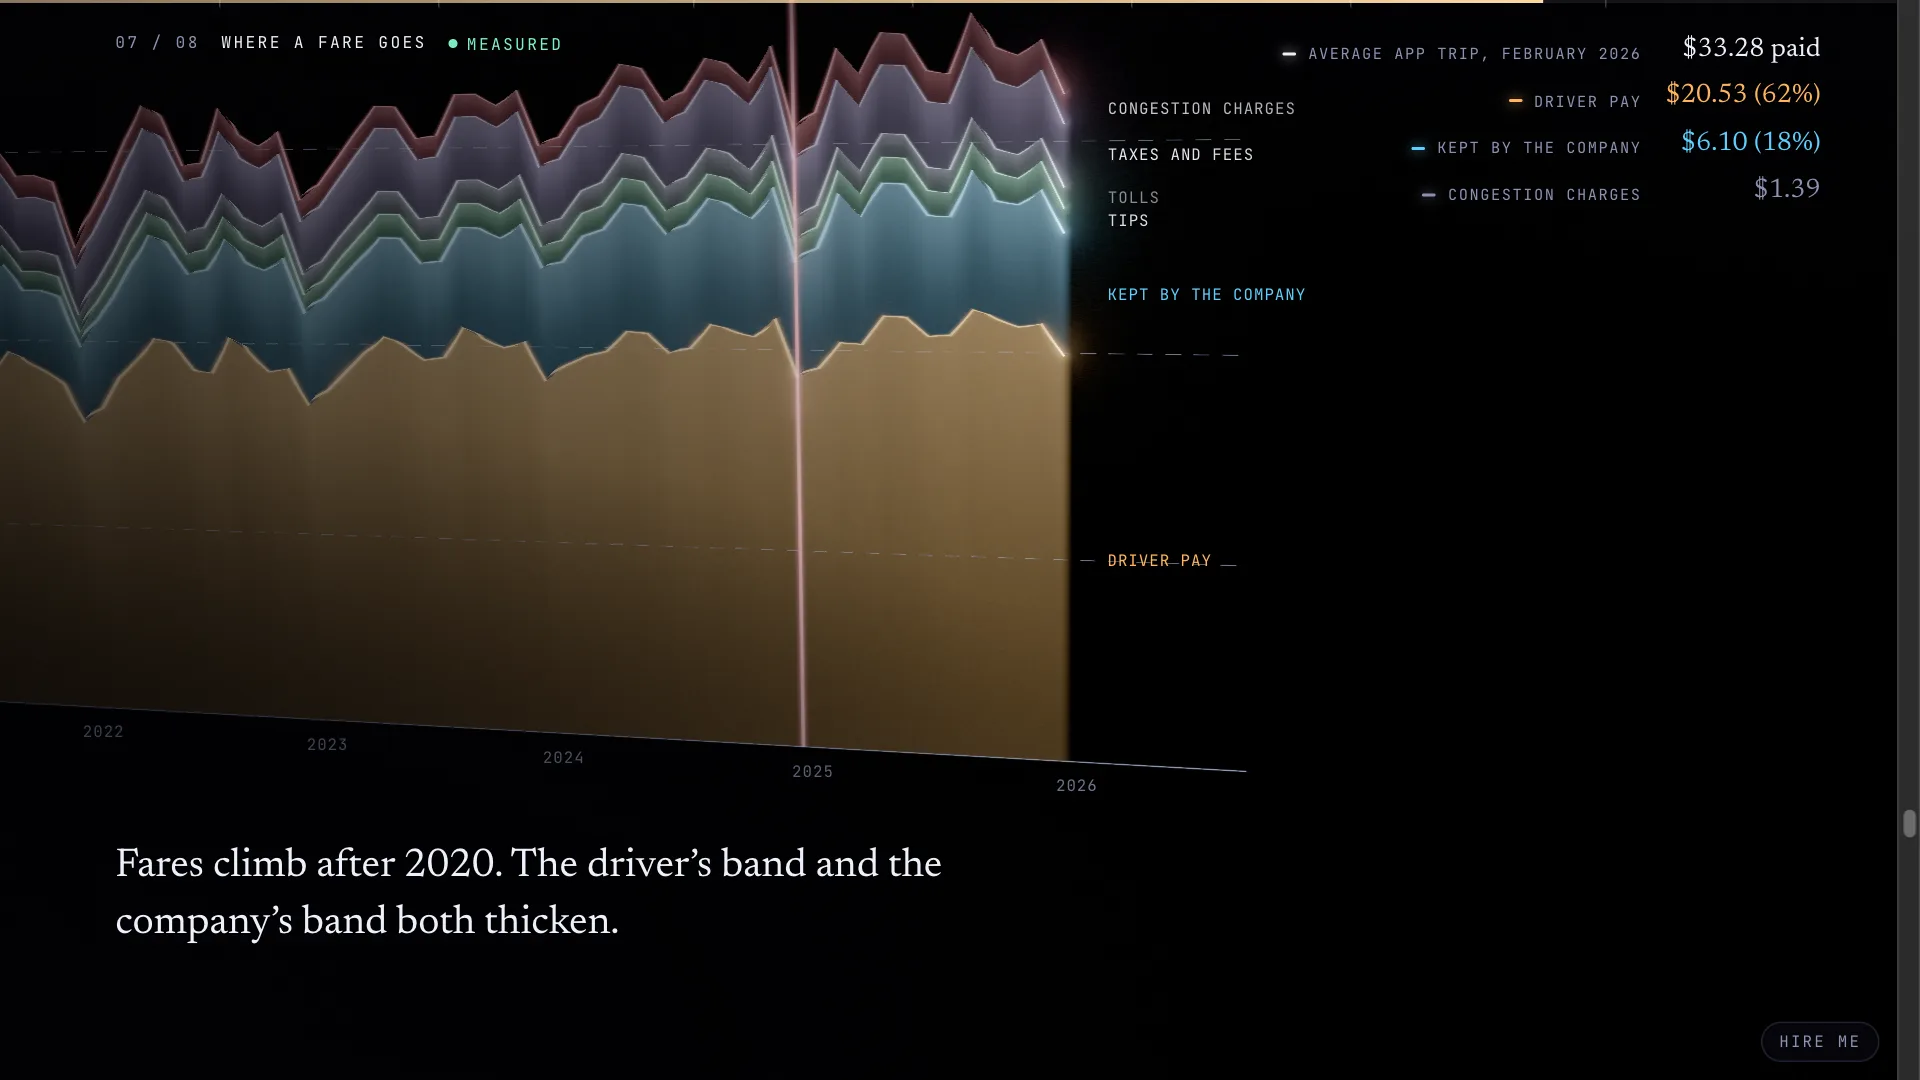
Over the last year of records, 7 percent of yellow pickups were outside Manhattan and 64 percent of app pickups were. The apps took riders from the taxi, but most of their trips start in places a yellow cab rarely went, and many of them never leave the neighborhood they start in. March 2020 is its own stage. In the week around May 5 the taxis were running at about 5 percent of a normal February day, and the app rides at a quarter. The apps came most of the way back and the taxi did not. The money stage splits the average app fare from 2019 on into what the driver was paid, what the company kept, and the tolls, taxes and fees. In February 2026 a rider paid $33.28 on average, the driver got $20.53 of it, and the Manhattan congestion charge that started in January 2025 added $1.39.
Getting 82 GB of New York taxi data onto one laptop
The plan was to let DuckDB read the files straight off the Commission’s host and pull only the columns each question needed. That plan ended on the first try, because the files sit behind CloudFront and a burst of a few hundred small requests got my address blocked with a 403 for several minutes. So the pipeline downloads each file whole, in one request, aggregates it on the laptop and deletes it, three files at a time, and when it does get a 403 it waits five minutes and carries on, which is slow but always finishes. The per-file timings add up to about three and a half hours of work, and none of it needs to run again unless I want a newer month.
Most of the code went into decisions about what counts. The files carry stray rows with dates in the wrong year, so a trip belongs to a month only if its pickup time is in that month, and the manifest records both the rows read and the trips counted so anyone can see the difference. A few fares are absurd, so the money totals use only trips with plausible amounts and keep the count of those trips so the averages stay honest. The 2009 and 2010 taxi files record each pickup as a coordinate where every later file records a zone, so those years feed a 2048 by 2048 density grid over the city, and that grid is what draws Manhattan’s streets in the second stage. A company’s order history or CRM has the same kind of problems, and cleaning them up usually takes longer than anyone planned. The aggregates fit in a 189 MB cache, and the page loads about 12 MB of packed tables, so a phone can scroll through four billion rows without waiting.
DuckDB-WASM answers the last question in your browser
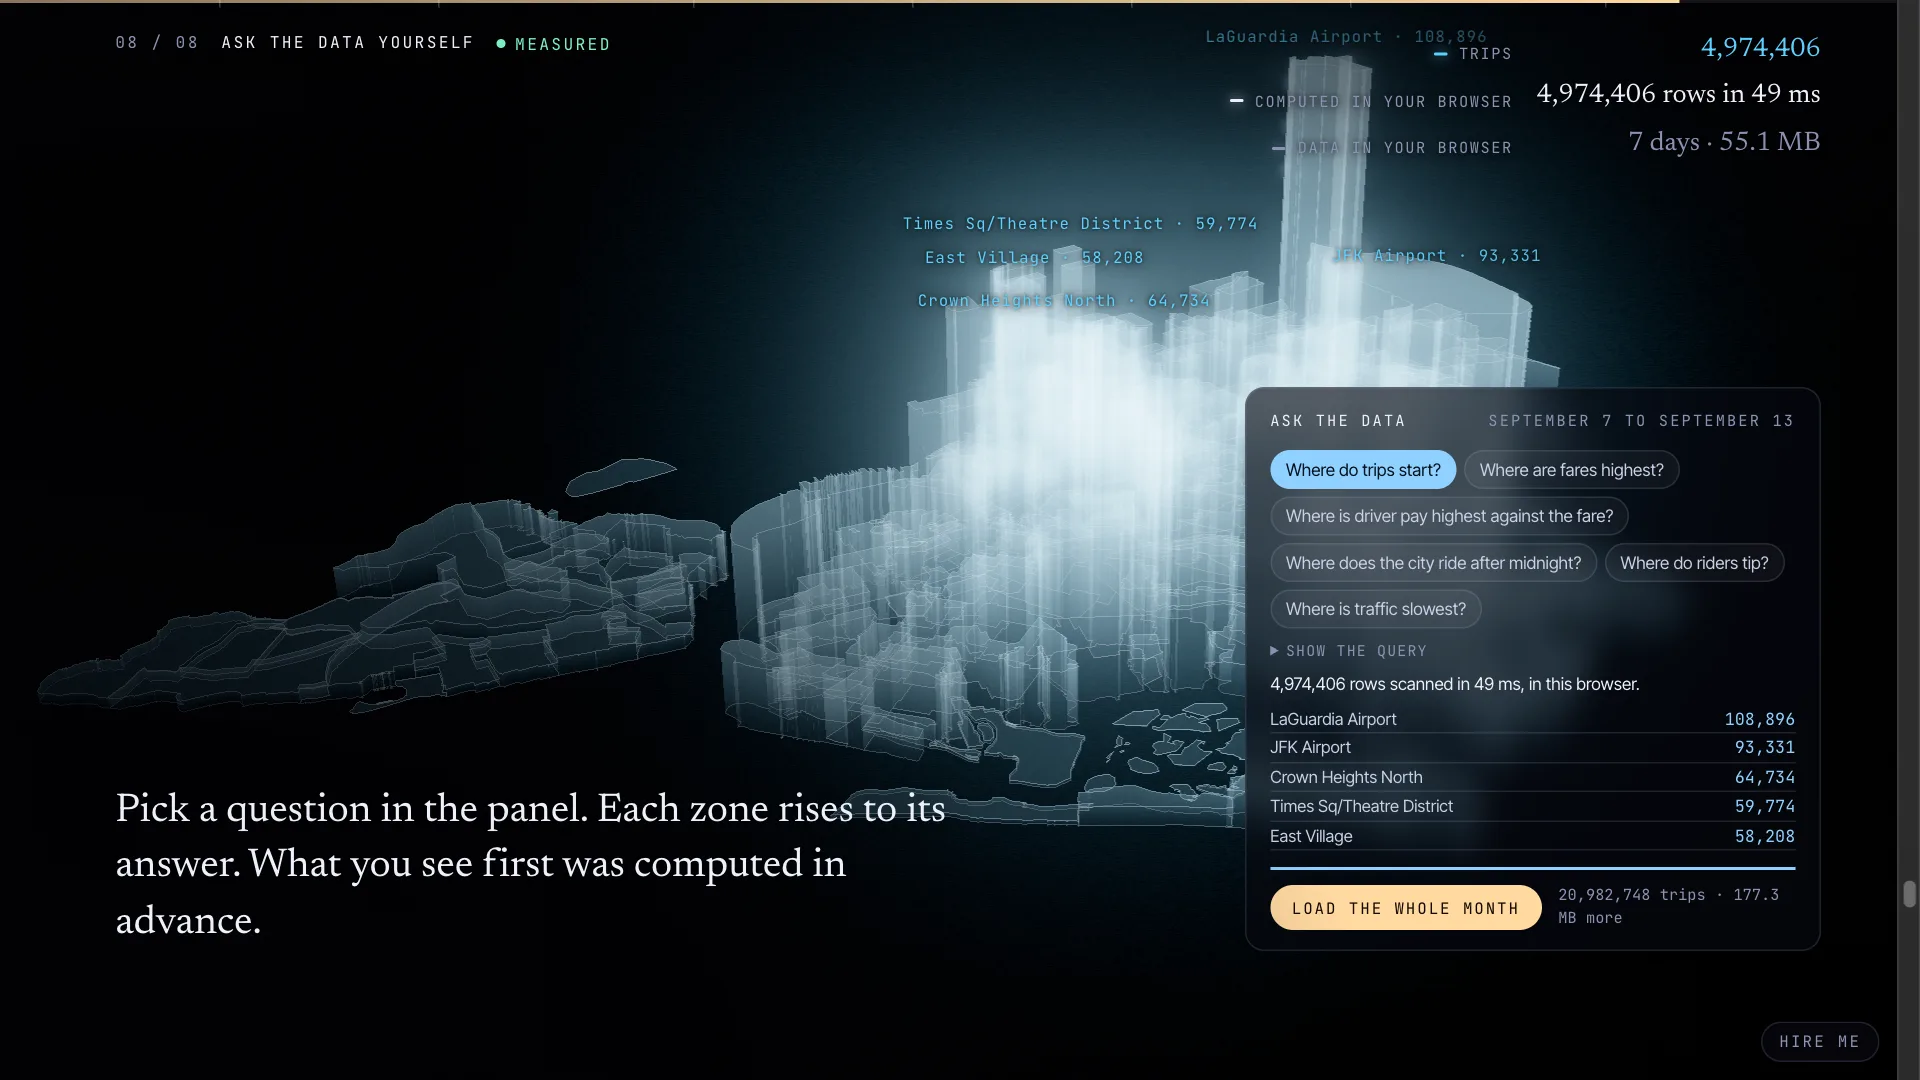
Everything up to the finale is counted in advance, because nobody should download 82 GB to read a chart. The finale instead holds one month of app trips, September 2026, trimmed to nine columns and split into one Parquet file per day, and it shows answers computed ahead of time for its preset questions: where trips start, where fares are highest, where the driver’s share of the fare is best, where the city rides after midnight, where people tip, and where traffic is slowest. Press Run and the browser downloads DuckDB compiled to WebAssembly and a week of trips, about 55 MB, and works the answer out itself. On my laptop it scanned 4,974,406 rows in 49 milliseconds. Nothing is sent to a server, and you can load the rest of the month and ask again.
The same queries run offline when the data is built, and a browser test runs every preset against the live engine and compares the two sets of answers, so the precomputed numbers and the live ones cannot drift apart. That test is also how I found the one bug that only happened in production. DuckDB fetches its Parquet reader from its own extension host on the first query, and the site’s content security policy blocked it. The development server sends no policy, so everything passed there, and only running the checks against the built site caught it. If the host is ever unreachable, the panel keeps the precomputed answers and says so.
The page is static files on Cloudflare. There is no database to run and no server to pay for, and the 3D runs on WebGPU where the browser has it, on WebGL2 where it does not, and falls back to still images when neither works. One engineer built it with AI in a fraction of the time this used to take. The AI-assisted engineering page says how I work and what I check.
What big data visualization can do with your own data
What carries over from the taxi records to a business is mostly the cleanup and the decisions about what counts. A business usually has more of this data than it thinks, spread across the store, the ERP, the CRM, the help desk and the shared drive, and most of it is never read again after the day it was written.
For most companies I would start with a RAG vector database over their own documents. Manuals, procedures, past proposals and years of support email go into a vector store, in Postgres with pgvector or in Cloudflare Vectorize, and staff ask questions in plain language and get an answer with a link to the page it came from. The work is in the chunking, in keeping it current when a document changes, and in making every answer cite its source so nobody has to trust it blind. The same embeddings make catalog search work by meaning, so a store with tens of thousands of products can find “waterproof boots for a toddler” when no product title says that.
Every order the ERP has ever taken, loaded into DuckDB the way the taxi records were, will answer questions its built-in reports cannot, like which customers used to order every month and have stopped, or what the margin is by zip code, and the answers can become a page the owner opens on Monday morning with no BI license. I wrote about that page in one screen for the whole business. The same tools can watch refunds and inventory adjustments for the ones that do not fit the pattern, so they are caught the week they happen.
Public data gets more useful once you join it to your own. Ramsey and Hennepin counties publish parcels and permits, and NOAA publishes every storm report with its location. A Twin Cities roofer could lay the hail reports from last night’s storm over the addresses of every past job and know where to send crews by breakfast, and a franchise could compare neighborhoods on foot traffic and household income before it signs a lease. A weekly sales page needs the same care I gave Hailed, with plain labels, a note on where each number came from, and a table under every chart.
If you have data like this and nobody can see into it, send me the first question you would ask it, and I will say what answering it would take. The data visualization and 3D page covers the rest of that work, AI integration and data covers the document search, and Hailed is on the demos page with the others.