What causes tides, and how a brass machine predicted them
The Moon and the Sun pull the ocean into a wave that runs around every basin on Earth. I built a page that shows it happening in San Francisco Bay, then turns the crank on the brass machine that predicted American tides until 1965.
Most people know the Moon has something to do with the tides, and that is usually where the explanation stops. It stopped there for me too, until I started reading about the machines that used to predict them. For most of a century the tide tables for American ports came out of a cabinet of brass gears and pulleys almost eleven feet long, and nothing inside it knew anything about the Moon. So I built a page that shows both halves at tide-machine.balian.dev: the water moving in San Francisco Bay, built from real terrain and depth soundings, and the machines that predicted it, turning in your browser. Every water level on the page is computed from the same harmonic constants NOAA uses and checked against NOAA’s official predictions.
What causes tides?
The Moon pulls on every part of Earth, but gravity weakens with distance, so the side facing the Moon gets pulled a little harder than Earth’s center and the far side a little less. Across the width of the planet the Moon’s pull changes by about 7 percent. Earth as a whole falls toward the Moon at the rate set by the pull on its middle, and once you take that shared pull away, what is left stretches the planet along the line to the Moon. The near side is pulled ahead and the far side is left behind, so an ocean free to follow would stand in two bulges, one under the Moon and one directly opposite. Newton worked this out in 1687. The bulges he calculated are only 36 centimeters high, and the page draws them a million times taller so you can see them at all.
Why are there two high tides a day?
Earth turns under those two bulges, so a city on the coast rides into one, out of it, into the other and out again, which gives two high tides and two low tides. It takes a little longer than a day, because while Earth turns the Moon moves on about 12 degrees along its orbit, and the coast needs about 50 more minutes to catch up with it. That makes a lunar day 24 hours and 50 minutes long, and the twice-daily tide repeats every 12 hours and 25 minutes. Tide gauges everywhere on Earth record that rhythm, and oceanographers call it M2.
How do tides work in the real ocean?
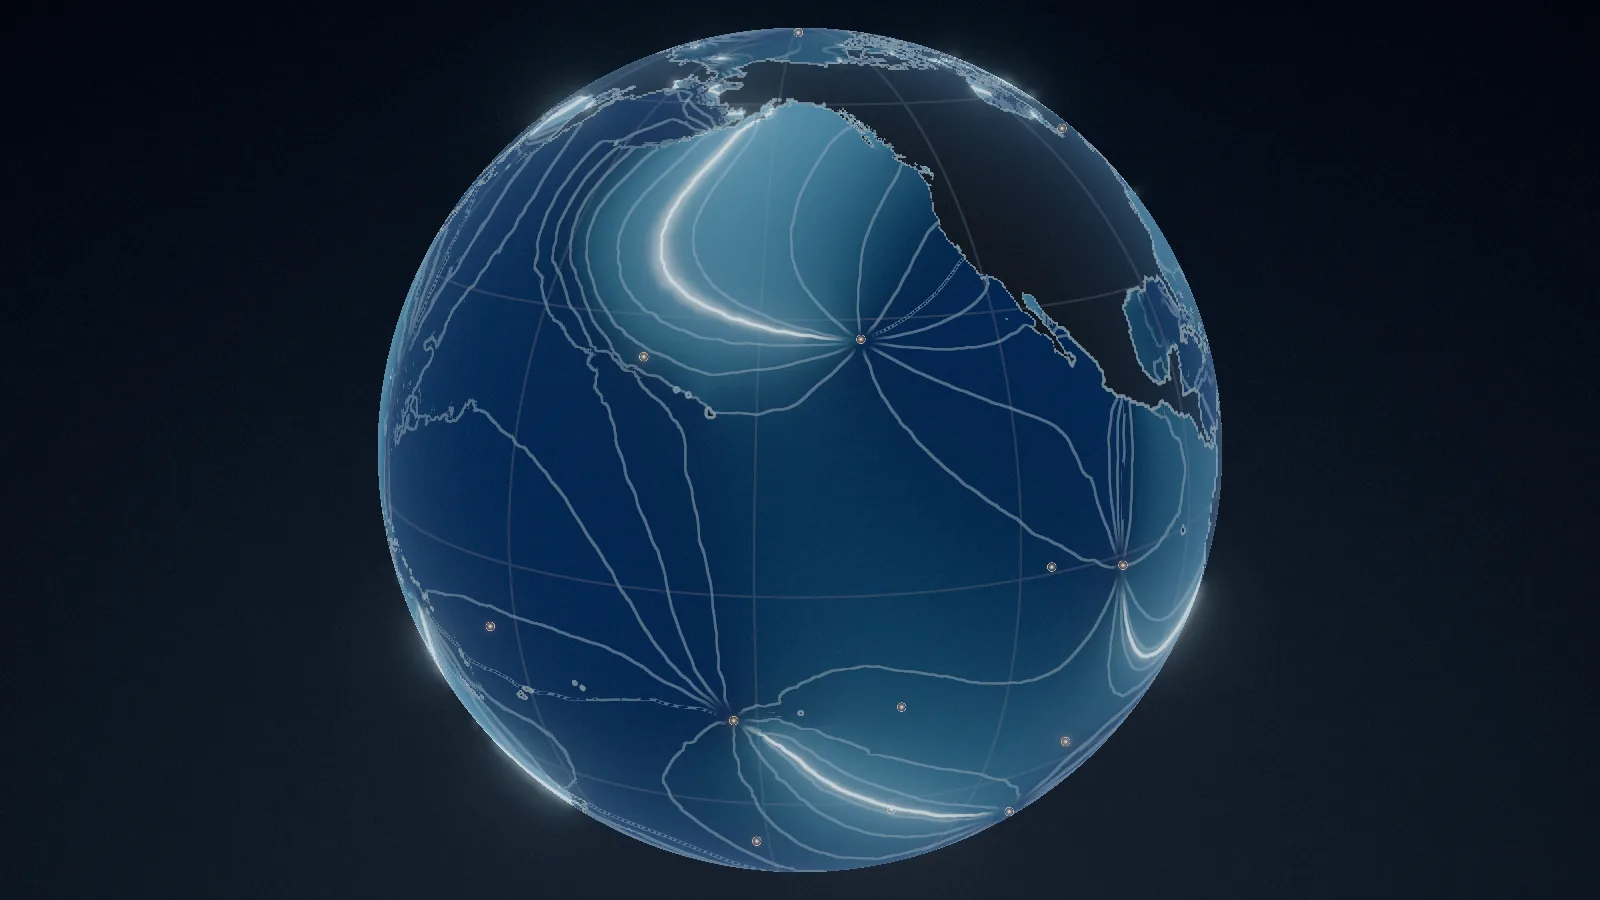
Newton’s bulges get the rhythm right, but they miss how big the tide is and when it arrives. The Moon’s twice-daily tide at San Francisco is 58 centimeters, much bigger than the bulge, and it arrives hours late. The reason is that the ocean cannot keep up. A tide wave in water 4 kilometers deep travels about 700 kilometers an hour, and to stay under the Moon at the equator it would need to go 1,600. The continents get in the way as well. So the Moon pumps each ocean basin twice a day, and the water answers with a wave that runs around the edges of the basin and wheels around points in the middle where there is almost no tide at all. The globe on the page draws that wave from EOT20, a model built from decades of satellite measurements of the sea surface, and the bright line of high water turns around those points like the hand of a clock. Along the West Coast the crest runs north. It reaches San Diego first, San Francisco 2 hours and 14 minutes later, and Seattle almost 8 hours after San Diego.
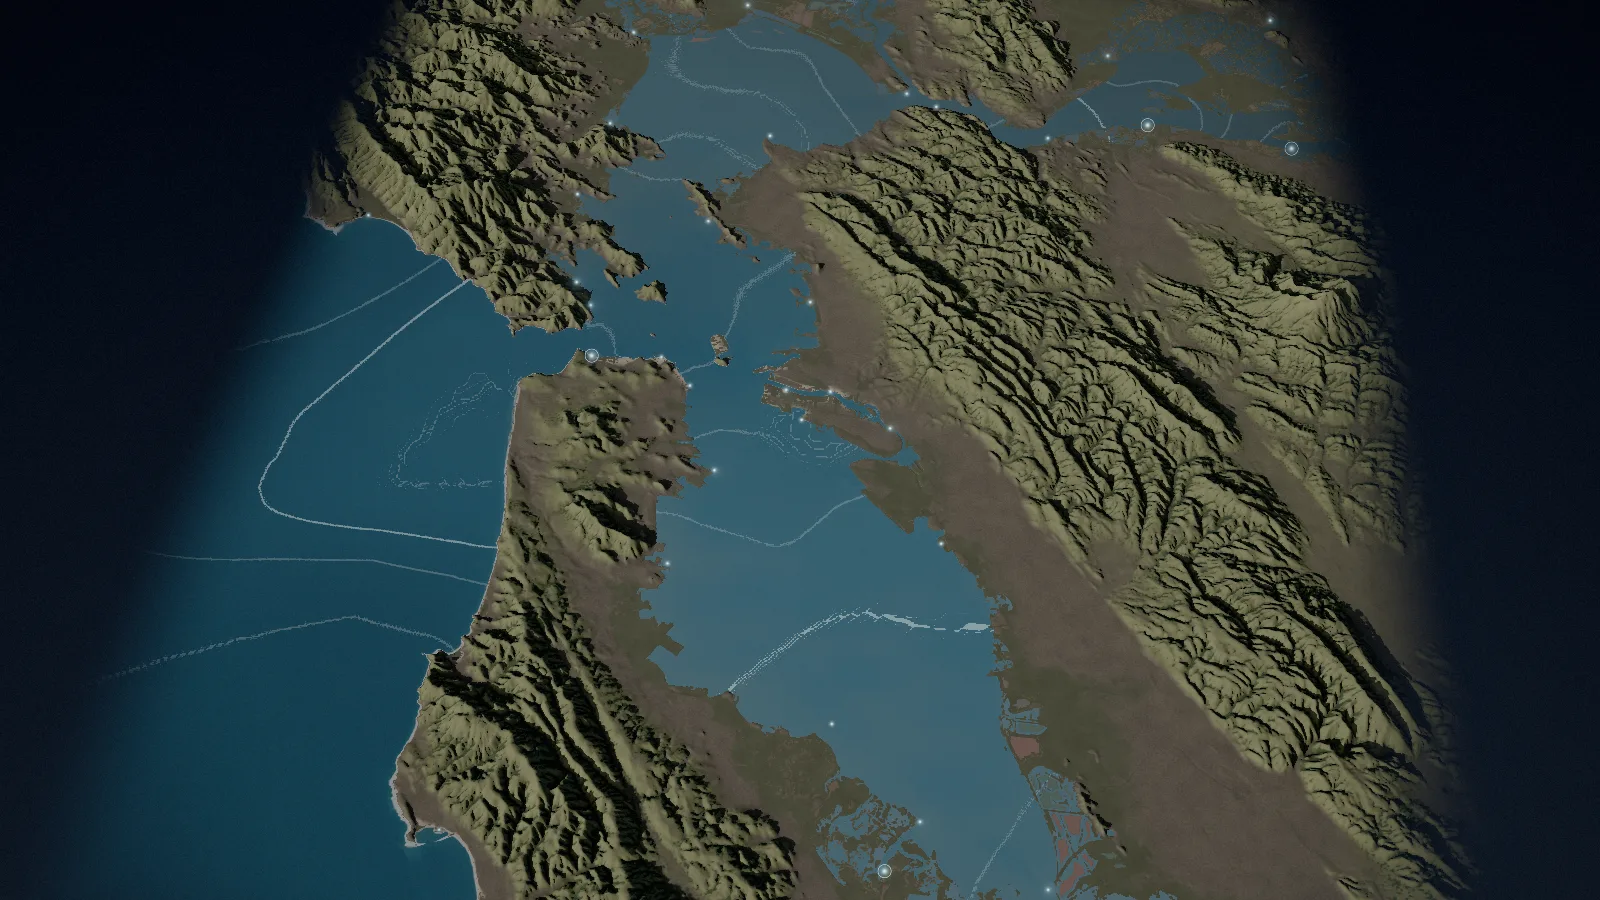
Then the wave reaches the Golden Gate. A long wave slows down in shallow water, and inside the bay the tide moves at about 36 kilometers an hour, the pace of a bicycle. The page fills the bay with water from the predictions of 35 NOAA tide stations, and you can watch high water reach the Gate and take another hour to reach Redwood City. It arrives at Port Chicago up in Suisun Bay more than two hours late. The South Bay is a dead end, so the wave reflects off it and grows, and the range goes from 2.72 meters at the Gate to 3.59 meters at Coyote Creek.
Spring and neap tides
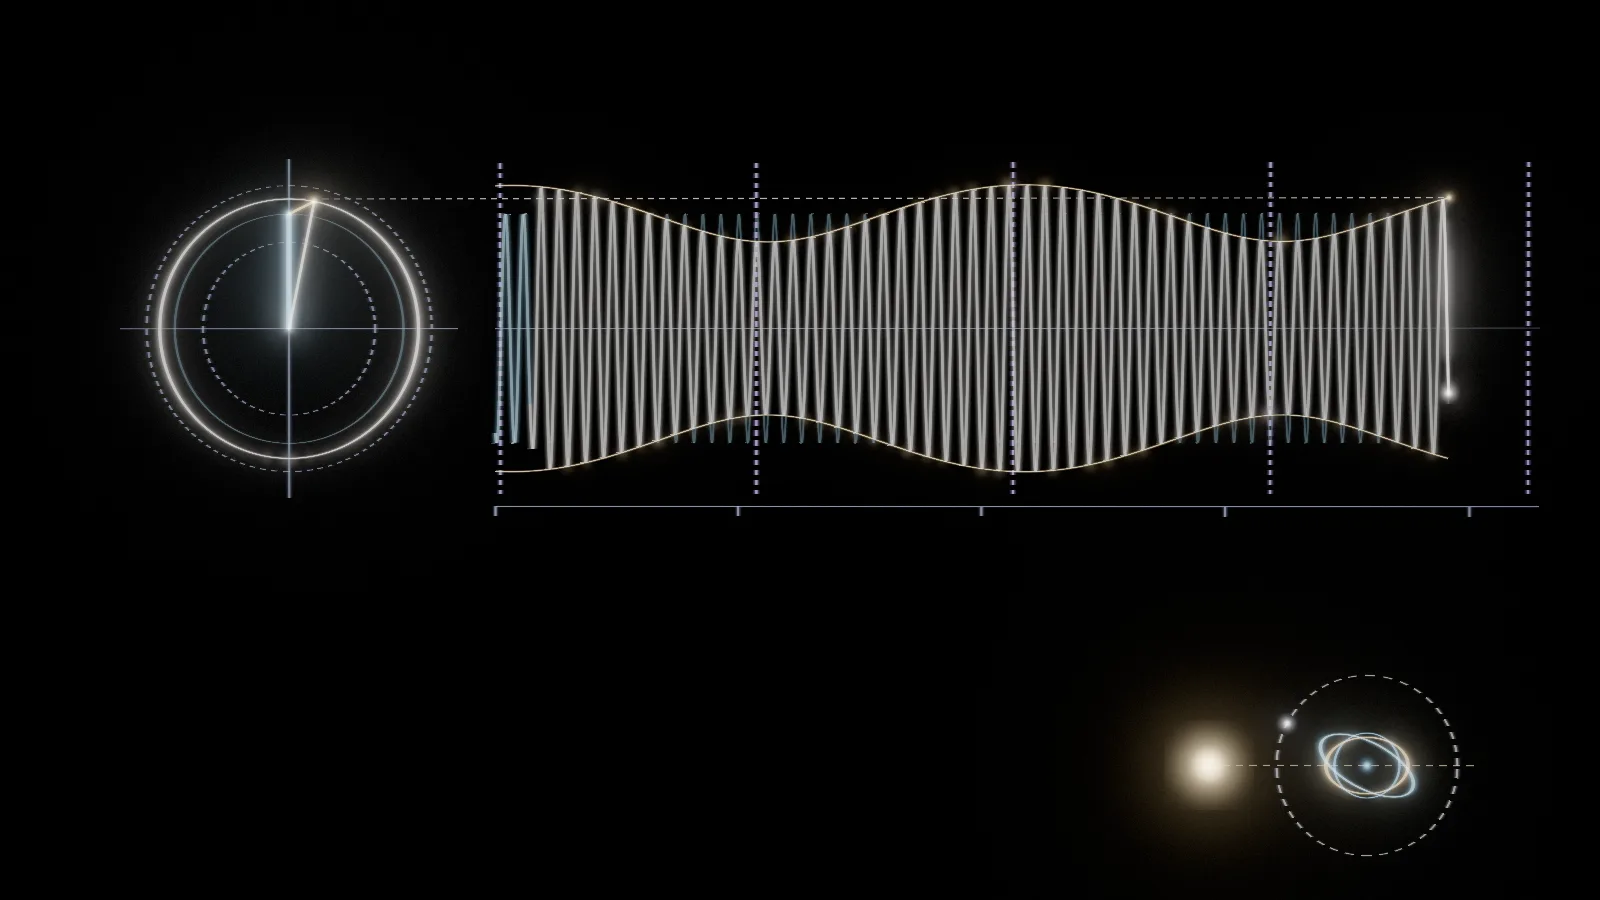
The Sun raises tides as well. It is 27 million times heavier than the Moon and 390 times farther away, and the pull that makes tides falls off with the cube of distance, so the Sun’s tide comes out a bit under half the Moon’s. It repeats every 12 hours exactly, while the Moon’s repeats every 12 hours and 25 minutes, so the two drift in and out of step. When they line up, at new moon and full moon, the tides are big, and those are spring tides. When they work against each other at the quarter moons, the tides are small, and those are neap tides. At San Francisco the two together come to about 0.7 meters at springs and about 0.4 at neaps, and the cycle repeats every 14.77 days. The page draws it as two arms on a dial, one hung on the end of the other, with the tip tracing the sum.
The Moon’s tilt and its changing distance add rhythms of their own, and so do the seasons and the shallow water of the bay. NOAA lists 37 of them for San Francisco. Each has a speed fixed by astronomy and a height and timing measured at that one port, and the tide is what you get when you add them all up. The page takes a year of hourly readings from the Golden Gate gauge and fits 31 rhythms to it at once in about a tenth of a second, using the harmonic analysis Kelvin worked out in 1867.
A mechanical computer for the tides
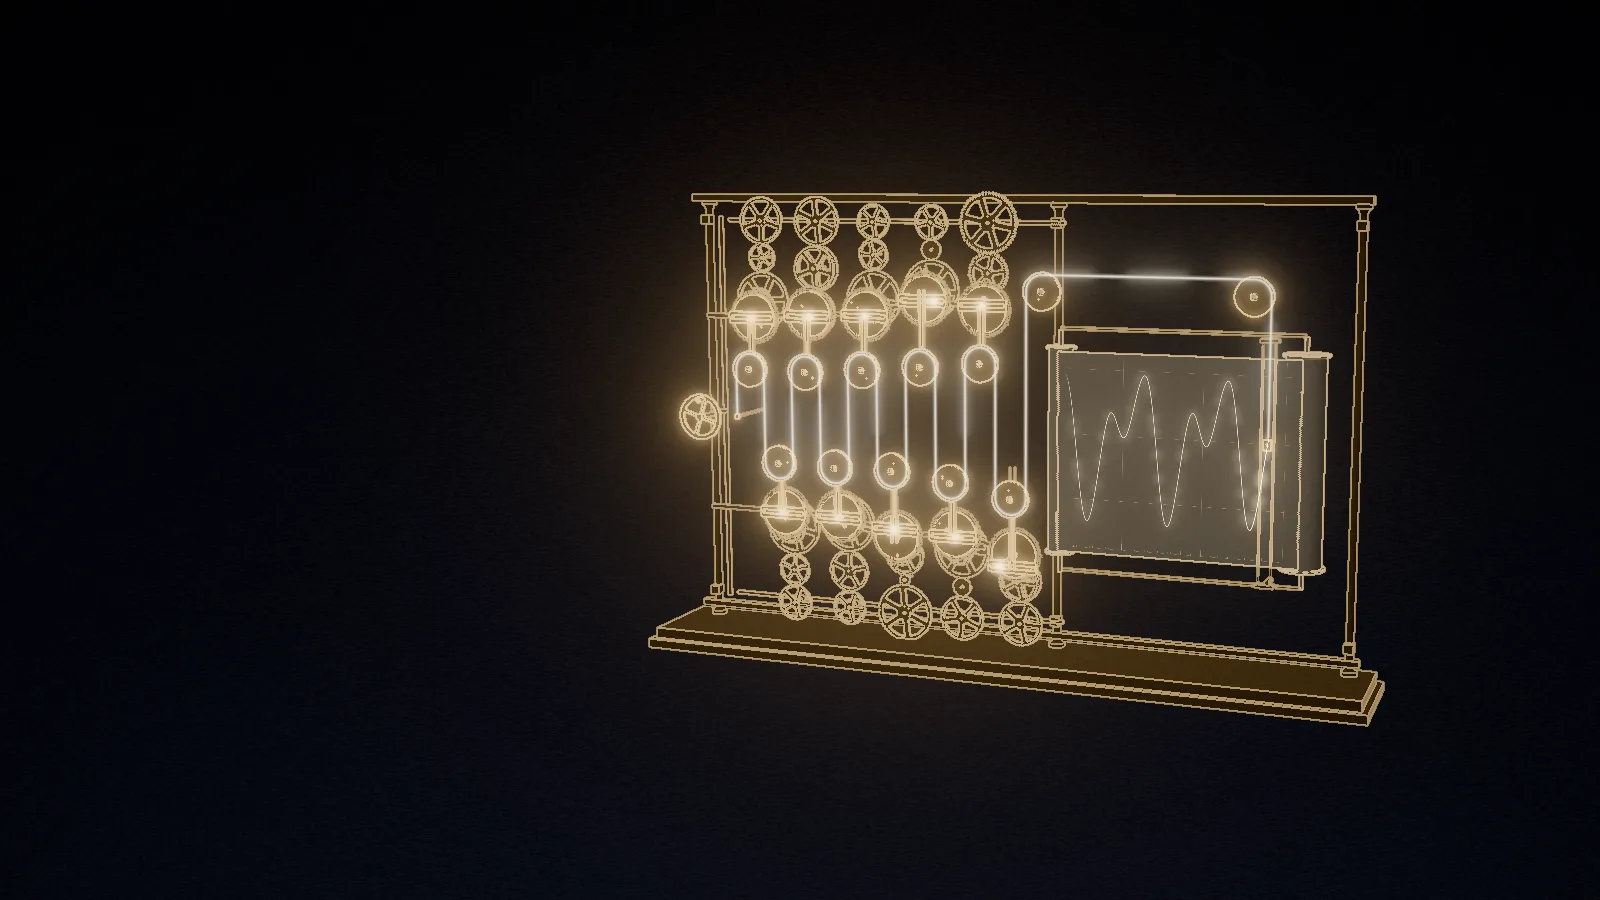
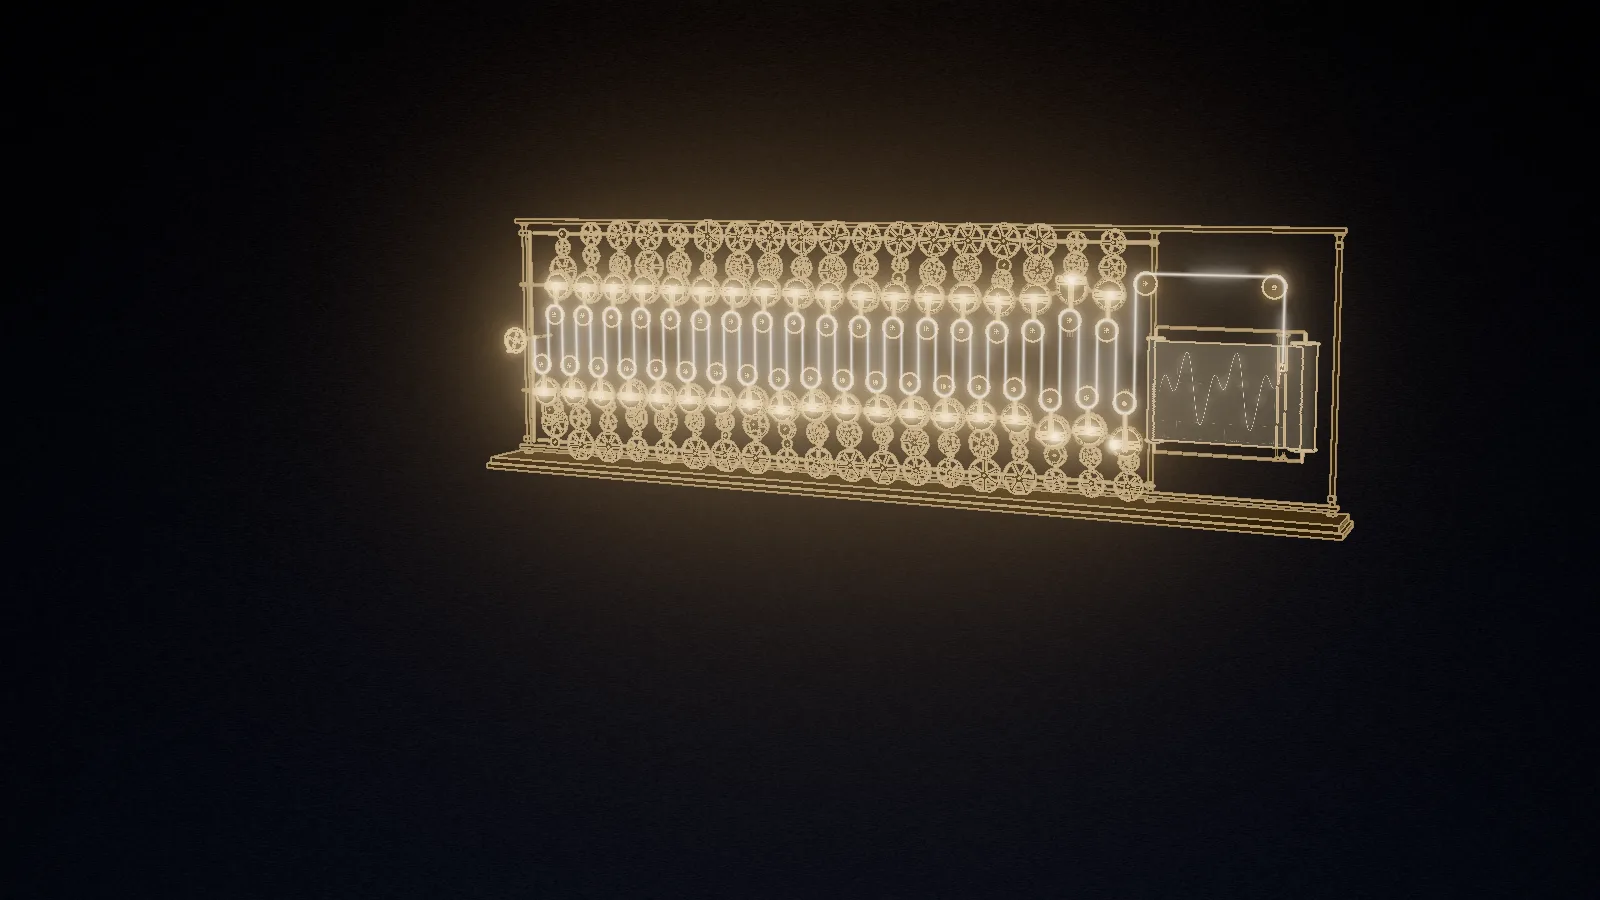
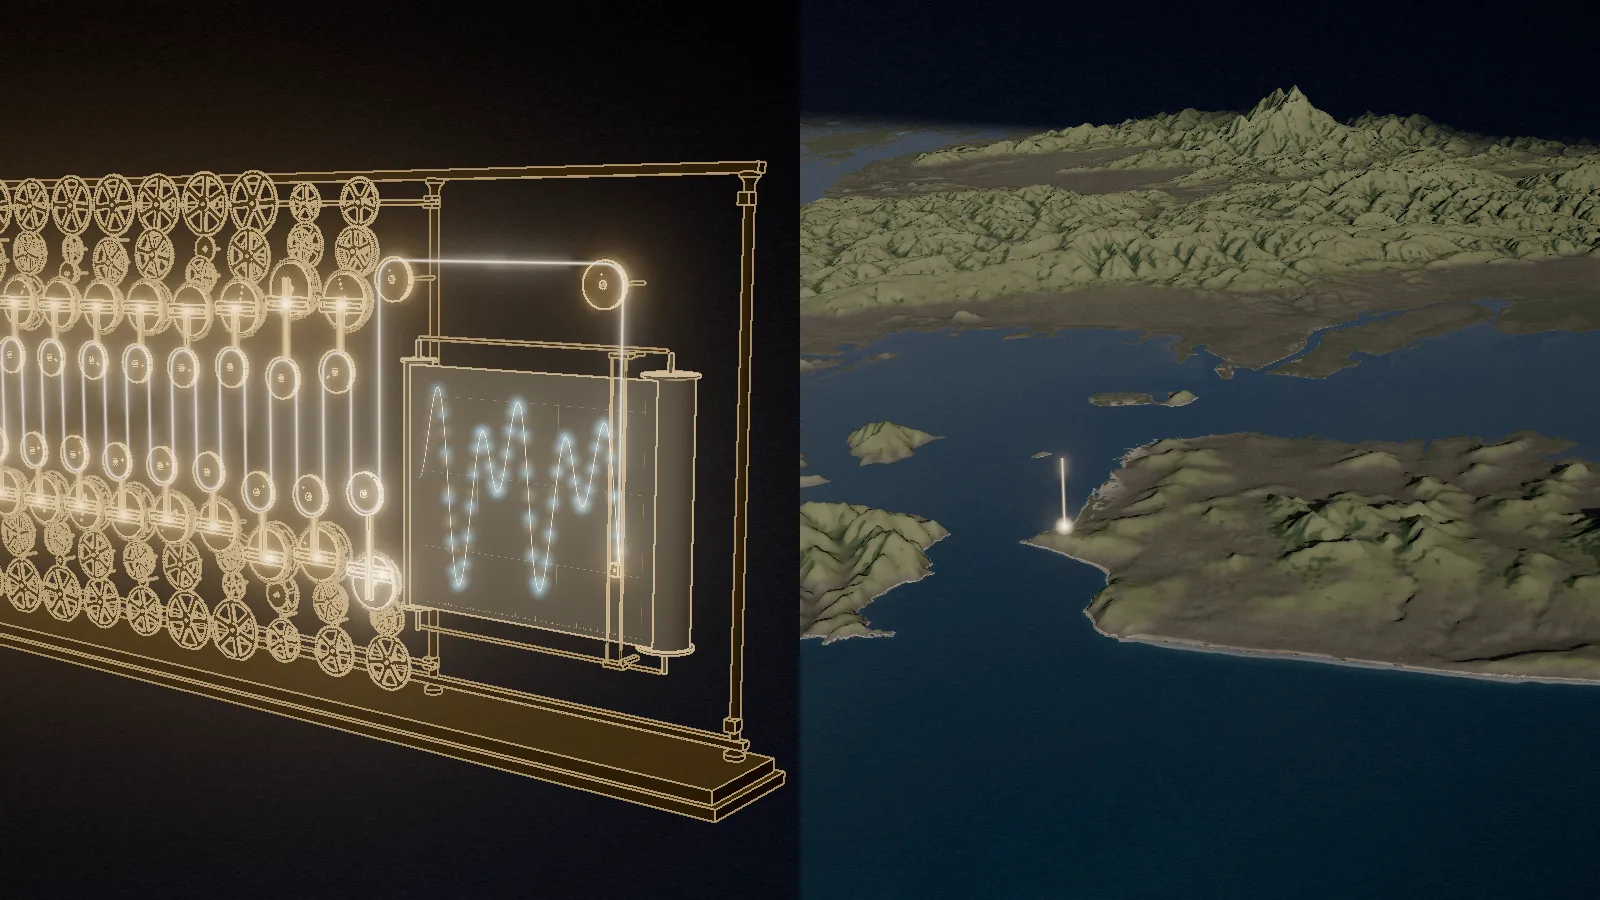
That sum was the hard part. Predicting a year for one port meant adding a dozen or more waves for every hour of it, and in 1872 William Thomson, later Lord Kelvin, designed a machine to do the adding. Each wave gets a crank. Gears turn the crank at that wave’s speed, and a pin set out from the center by the wave’s height moves a pulley up and down. A single wire runs under and over all the pulleys with a pen on the end. When any pulley moves, the pen moves with it, so the pen draws the sum of every wave on a roll of paper. Thomson’s machine had ten cranks, and turned by hand it drew a year of tides for a port in about four hours. The page builds it in front of you one crank at a time, set to San Francisco’s numbers, and the line on the paper turns into the bay’s tide.
I take watches apart for fun, so the gear trains are my favorite part. Each tooth count has to match a speed set by the Moon or the Sun. The Moon’s crank has to turn 1.9322736 times for every turn of the driving shaft, and gears only make ratios of whole numbers. On the page’s Kelvin machine, 176 teeth driving 169 and then 154 driving 83 give 1.9322735. Kelvin’s own tooth counts don’t survive, so those are the closest pairs I could find. The American machine’s counts were published, and when the page runs each of its cranks for a year against the sky, the Moon’s main crank ends the year 3 seconds off.
The United States built its own, Tide Predicting Machine No. 2, finished in 1910 and first used for the tide tables of 1912. It summed 37 waves with a fine steel chain and weighed about 2,500 pounds. People called it Old Brass Brains. It made the official US tide predictions until 1965, and during the Second World War it predicted the tides for the landings in Normandy and the Pacific. On the page you set it for San Francisco on New Year’s Day 2026 and turn the crank, and the pen and the water at the Golden Gate move together. NOAA’s official predictions for the same week are drawn on top as blue dots, and over 169 hourly values the machine and NOAA never differ by more than 2 centimeters.
When the sea disagrees with the prediction
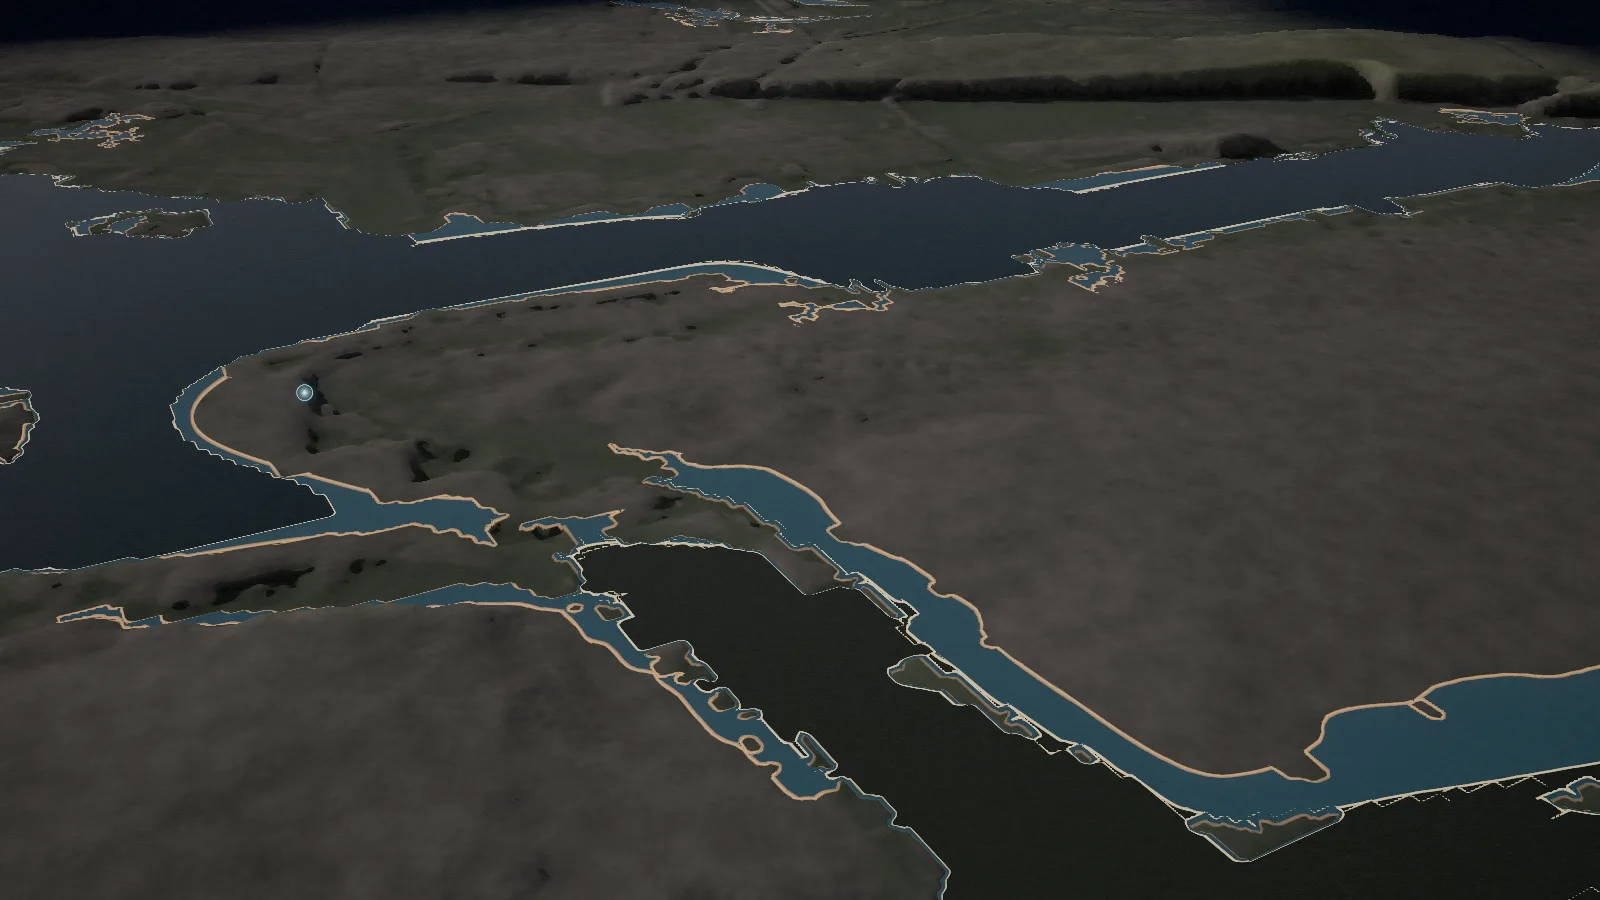
A tide prediction tells you where the water would stand if only the Moon and the Sun were acting on it. On most days the weather adds or takes away a few tens of centimeters. On October 29, 2012, Hurricane Sandy had been pushing the Atlantic toward New York for two days, and the page rebuilds Lower Manhattan for that evening. The tide tables called for an ordinary high tide of 1.48 meters at the Battery. At 9:24 that night the gauge read 4.28 meters, the highest since its record began in 1920, and the surge peaked 36 minutes after high tide on the day of a full moon. A gold line on the page marks where the tide tables put the shore, and everything past it is surge water the tables did not account for. That gap is why forecasters add storm surge models on top of the tide tables.
The tide on any coast on Earth
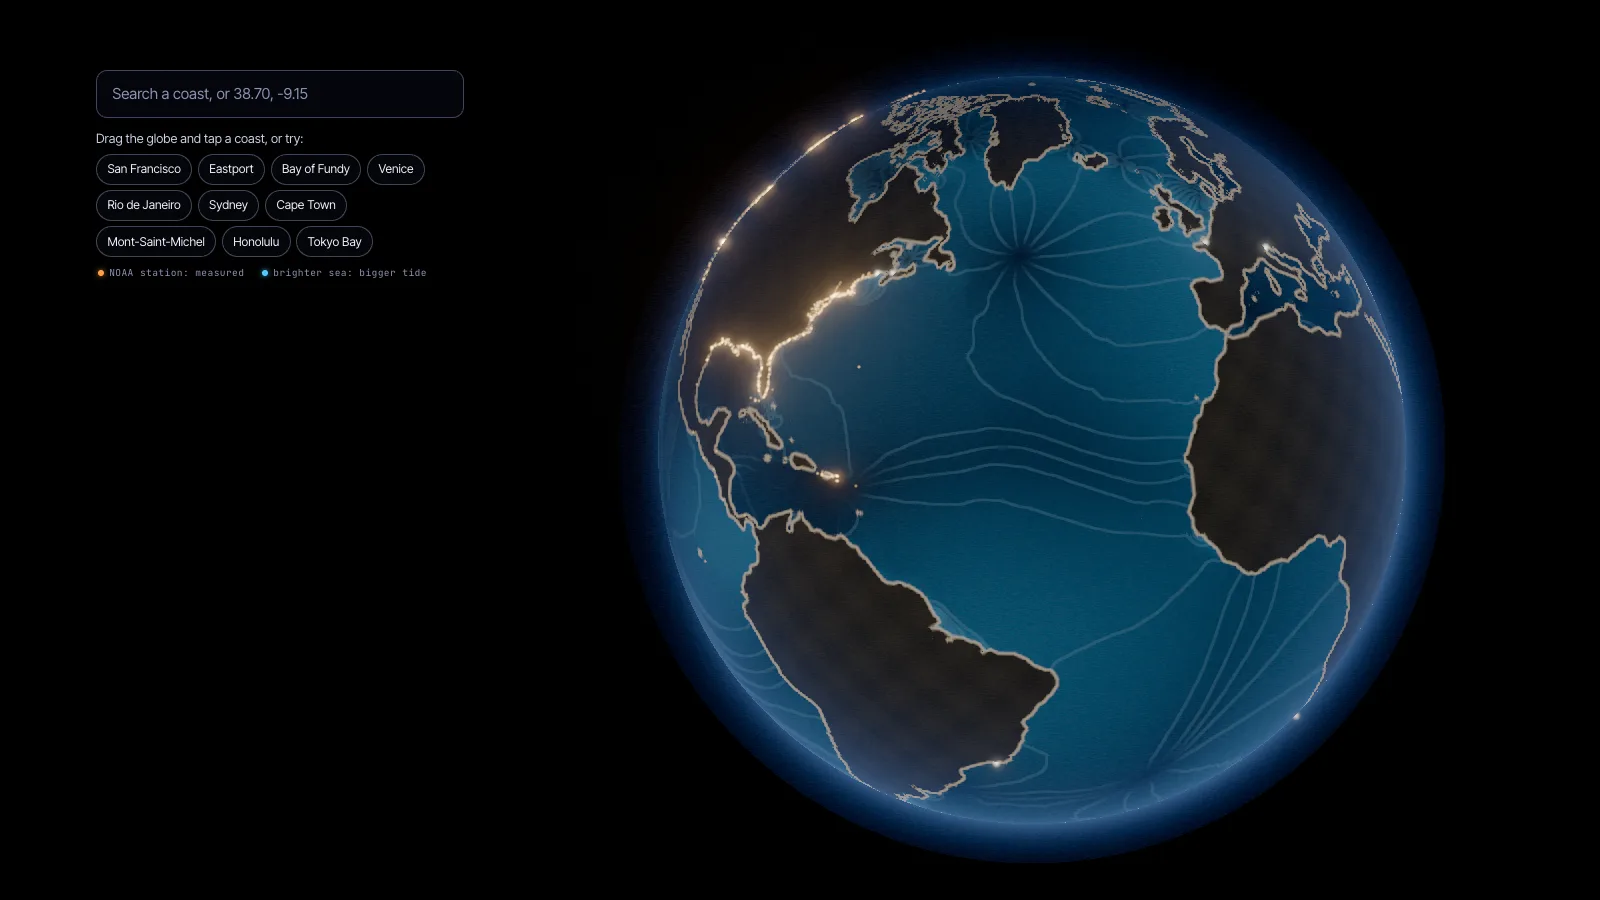
The end of the page is a globe you can spin. Tap any coast, or search for a place, and the page builds that coastline live from public terrain data and tells you the tide there right now, with the next high and the next low. Near one of NOAA’s 1,374 tide stations it uses that station’s own constants, and anywhere else in the world it uses EOT20. A label at the top says which kind of number you are looking at. Old Brass Brains is then set to that place and draws its week, and you can drag its crank and watch the water follow. Here is San Francisco, and the Bay of Fundy and Mont-Saint-Michel are among the suggestions if you want to see a really big tide.
What this means for a business
Tides are a good example of data that is far easier to understand when you can watch it move. A table of 37 numbers per port is correct, but most readers can’t do much with it. When the same numbers drive water in a 3D bay, people get it in a few seconds. Underneath, the page uses public data from NOAA and from satellites and a prediction routine tested against the official tables to within a centimeter at San Francisco. The renderer runs on WebGPU where the browser supports it and falls back to WebGL2 where it does not. The same approach works for your own numbers, like a warehouse or a delivery network, and the data visualization and 3D page covers what that looks like.
If you want to see how deep this kind of work can go with a much bigger pile of data, the big data post reads every New York taxi ride since 2009. The rest of what I have built is on the demos page, and if you have data that people should be able to see and understand, tell me about it.